

Public transport management game · in development
Transit Rush
Real city. Your network.
Plan the public transport of a real city: bus, tram, metro, light rail, ferry and coach on real maps. You decide stops, lines, frequency, vehicles, money and research.
The Steam page is not online yet. Once it exists, this button will lead straight to it.
Why it's different
Not a generic grid with generic numbers. A real city, computed for real.
Real streets, real buildings
Every street, every building outline, every river and hill comes from real map data, not a procedural grid. Curves, dead ends and awkward junctions are real, because the city is.
Real demand, not random numbers
Passengers come from actual residents, jobs and destinations per district, walking real footpaths to your stops. Time of day, weekday, weather and events change who travels when.
Lines that follow the street
Click stops and the line follows the real street, with its real curves, junctions and obstacles. No grid to hide behind: a tight corner is a tight corner.
Real cities, more to come
The playtest covers four real cities, each built from its own real map: Hamburg, London, New York and Paris. More cities are on the way.
What the game can do
Everything listed here is already in the game and can be tried in the test version.
Real cities
Streets, buildings, water and terrain come from real map data in the four playtest cities (Hamburg, London, New York, Paris), each a genuine, tens-of-kilometres-wide slice of the real place.
Six modes, one game
Click stops and the line follows the real streets. Bus, tram, light rail, metro, ferry and coach, each with its own frequency per time of day and weekday.
Metro with stations and curves
Build track with curves, switches and depth, place stations, look through the ground in a 3D cut. Buildings, water and tight curves set limits, marked in red right on the track.
A network map like on the wall
From your lines the game draws a schematic network map on its own, with filters per mode. "Find a journey" shows door-to-door trips with alternatives.
Passengers with a real daily rhythm
The game calculates passengers from residents, jobs and destinations per district, over real footpaths. Time of day, weekday, weather and events change who travels when.
Money and operations
Fares and the city's subsidy against vehicles, depots and credit. The monthly statement shows the result per line and where a different frequency would save money.
Research and workshop
Research unlocks what you may build, such as signal priority or tunnel boring, across four branches. The workshop retrofits vehicles you already own.
Career and free play
In the career the city pays contracts with a budget and a bonus, and money matters. In free play you choose: all research unlocked, unlimited money, or both.
Simulation depth
Behind the windows there is a model, not a script. Passengers are calculated per district, time band and kind of day. This is what the model does in the test version, in plain words.
Demand from the district up
The map is cut into small hexagonal cells. Each has residents, jobs and leisure value, estimated from building footprints and heights and adjusted to real population figures. On a weekday each resident makes about 3.4 trips, split into work, leisure and errands.
Where you see it: The map views Residents, Jobs and Leisure.
Everyone chooses for themselves
Every trip picks between bus or train, car, bicycle and walking, by felt minutes: walking and waiting count double, each change costs minutes, a metro feels more comfortable than a bus. Households with and without a car are treated apart.
Where you see it: “Check a journey” shows the shares for any trip, Statistics shows how all trips split.
Real paths, hills, bikes and cars
A stop collects people by walking time along the real footpath network, and uphill takes longer. Rail draws from further away than a bus stop (the pull halves at 500 m of walking for a bus stop and at 800 m for rail). A bicycle can be the way to the stop, and racks raise that. In a dense centre at rush hour the car is slower and parking takes longer, which helps transit there.
Where you see it: The map views Walk time, Transit share and Car ownership, and the catchment in the stop window.
Time, weekday, weather, events
The day has five time bands, and Saturday carries 65 % and Sunday 45 % of a weekday. Weather is rolled per time band from the city’s climate: rain, snow, heat, frost and storm change walking, cycling, driving and bus running times, and in a storm the ferries stop. Stadiums and fairs have event days with arrival and departure waves.
Where you see it: The weather window (click the weather symbol) and the monthly report.
Full vehicles, extra services
Every section of every line is checked against its seats, per time band and direction. Whoever finds no room is left standing, which costs fares and satisfaction, and some look for another connection. Where it is full you add extra services on part of a line, and metro and light rail trains can run different lengths per time band.
Where you see it: The “Too full” list in Statistics, the map view Crowding, and Fleet, Demand per line.
Drivers, wear and accidents
Drivers are limited: on duty, in training and needed per weekday. You recruit, hire experienced drivers and face a wage round every few years. Sick calls hit a share of the duties; spare drivers and a standby duty cover them, the rest of the trips are cancelled. Vehicles wear out, break down and have accidents on the road; you can insure yourself or rent out spare vehicles at weekends.
Where you see it: The Fleet window with its Staff tab.
Money, line by line
Fares and a payment from the city per passenger are set against the costs per vehicle hour (drivers, energy, workshop), stops, stations, track, depots, research and interest. Raise the fare and you lose passengers, a little at first and more after a year. Fare evasion is estimated per line, and inspections and gates reduce it.
Where you see it: The flow diagram in Finances, the monthly statement per line and the map view Profitability for every stop.
Credit, grants, contracts
Your credit line follows yearly revenue plus half the value of your assets. Interest is booked daily, and a credit rating from A to D moves rate and limit. The city pays part of rail construction, more with every contract met. A contract is a connection between two areas with a passenger goal and twelve months: reach it and you keep the budget plus a bonus, miss it and the budget goes back.
Where you see it: Finances, tab Credit & grants, and the Contracts window in the career.
Screenshots
Pictures from the game, work in progress. Click one for the large view, use the arrow keys to browse and Esc to close.

Every line in detailThe window of a single line, here a new metro line in London, with its frequency. 
New York at nightManhattan in 3D, buildings in real outlines and heights, with metro and bus lines. 
Building a metroLay the track, set the depth, place the stations: a short metro line in London, step by step. 
A whole networkBus, metro and ferry lines across London on the real map. 
Where transit winsThe map view “Transit share” colours every area by how many of its trips to the network go by transit. 
Upgrade a bus line to a tramThe game shows the track works, the running time and the estimated riders before you confirm. 
Check a journeyDoor to door: changes, waiting time and walking, and who would really take the trip. 
How far is the nearest stop?The map view “Walk time” shows the minutes on foot to the nearest stop, over the real footpaths. 
Where vehicles are fullThe map view “Crowding” shows how full the vehicles are where people board, in their busiest hour. 
Statistics for the whole networkJourneys a day and the share of transit for the whole network. 
How people travelPassengers a day, transit share, and how all trips split between on foot, bicycle, bus and train, and car. 
Where the money goesThe flow from fares and the city’s payment to workshop, track, energy, drivers and profit. 
Credit, rating and grantsHow the credit line comes about, the credit rating, the interest and the city’s grant for construction. 
Drivers and sick callsThe staff tab of the fleet window: drivers on duty and needed, sick calls, cancelled duties and recruiting. 
What weather doesThe weather window compares what each kind of weather does to walking, cycling, cars and every mode. 
Unserved demandThe map view “Unserved demand” shows car trips per day and hectare where transit is missing or loses out. 
The research treeResearch unlocks, the workshop fits it in. 
Ferries on the ThamesA ferry line from pier to pier on the Thames, in service.


Map data © OpenStreetMap contributors (ODbL). Interface, numbers and looks may change before release.
Cities
These four cities are in the playtest, each built from real map data and each a slice of up to 120 × 120 km of the real place.
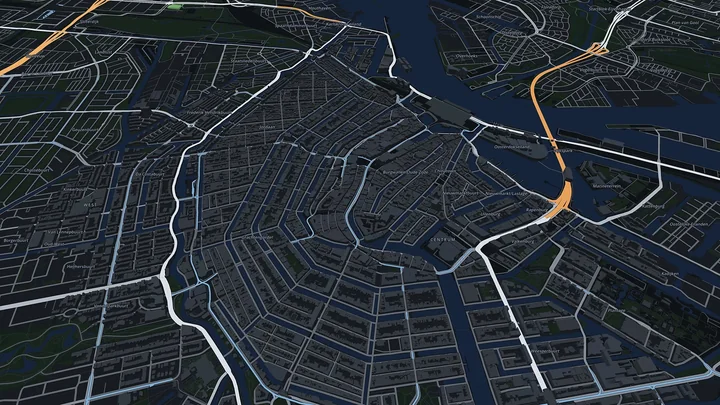
Amsterdam
About 8.9 million residents in the map area, some 2.8 million buildings. With its canal ring right at the centre.
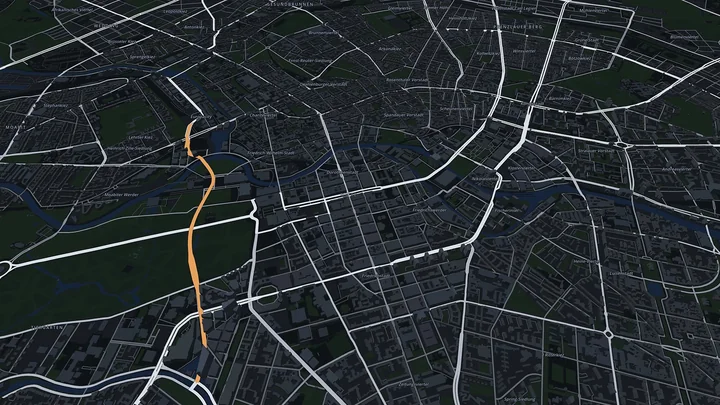
Berlin
About 5.7 million residents in the map area, some 1.1 million buildings. With the Spree running through Mitte.
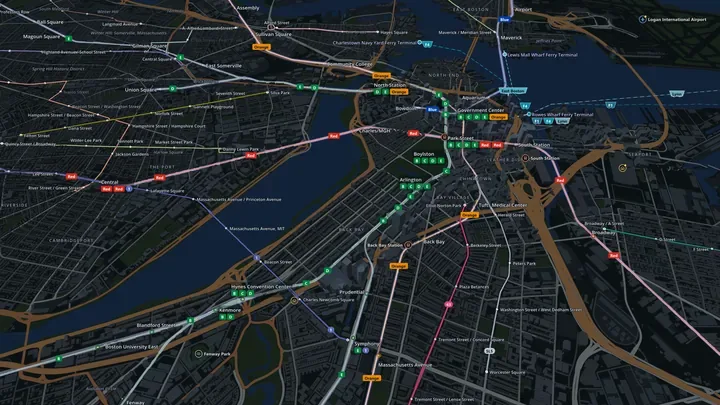
Boston
About 6.0 million residents in the map area, some 1.5 million buildings. With the Charles River and the harbour islands.
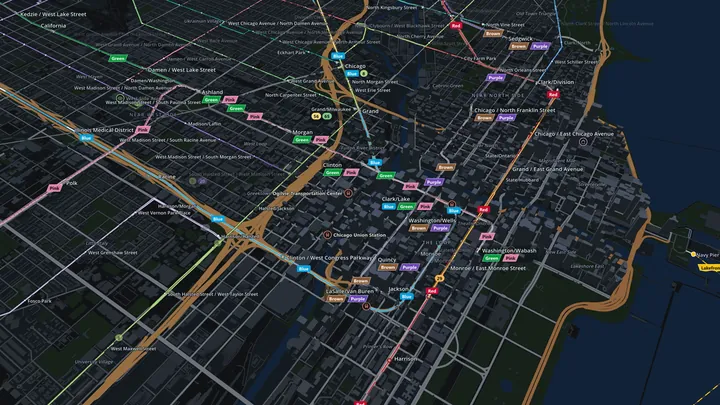
Chicago
About 8.7 million residents in the map area, some 2.2 million buildings. On the shore of Lake Michigan, the Loop at its heart.
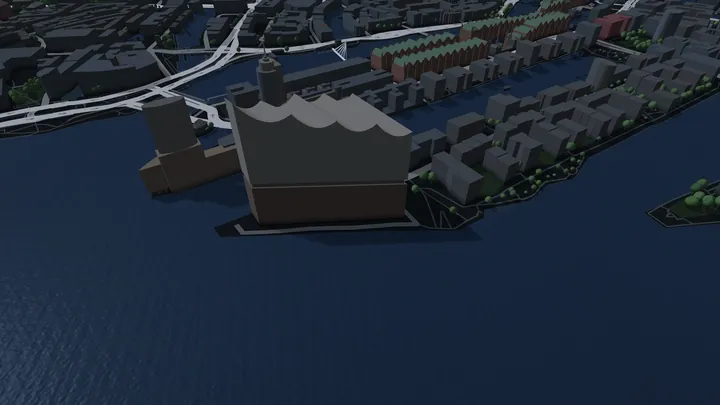
Hamburg
About 4.4 million residents in the map area, some 1.2 million buildings. With the Elbe, the Alster and the port.
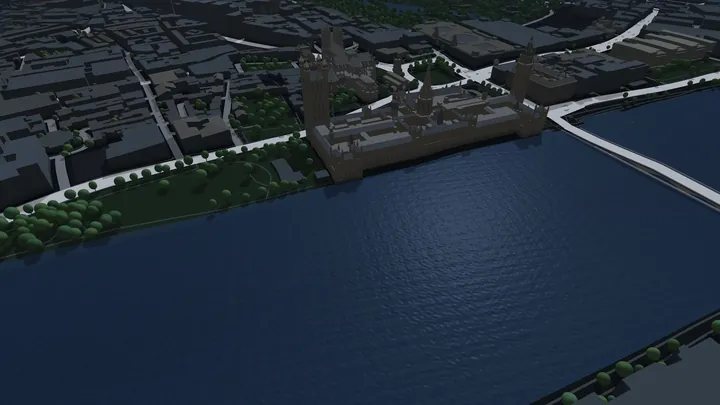
London
About 18 million residents in the map area, some 2.4 million buildings. With the Thames right through the middle.
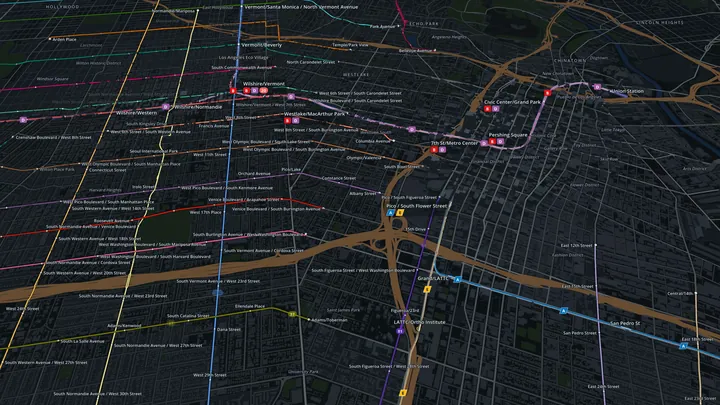
Los Angeles
About 13.5 million residents in the map area, some 3.4 million buildings. With the Pacific coast and the long boulevards of the basin.
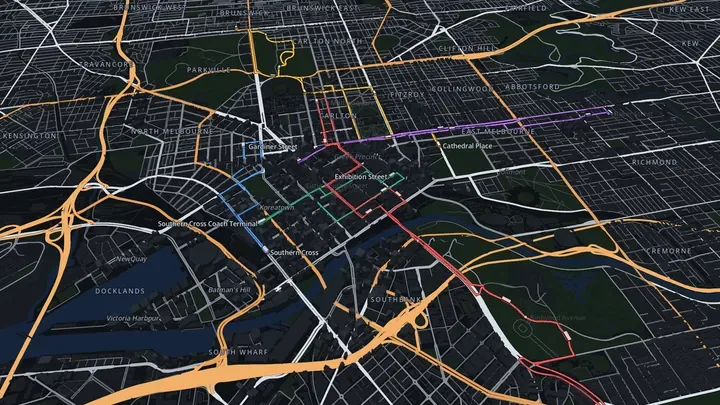
Melbourne
About 5.7 million residents in the map area, some 1.8 million buildings. With the Yarra and Port Phillip Bay.
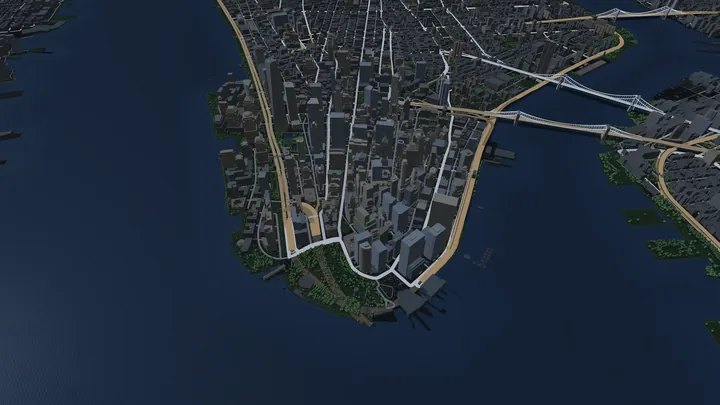
New York
About 18 million residents in the map area, some 2.4 million buildings. With the Hudson, the East River and Manhattan.
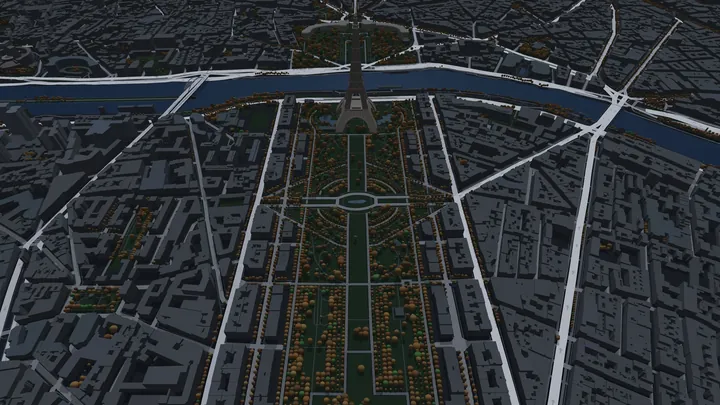
Paris
About 13 million residents in the map area, some 2.3 million buildings. With the Seine winding through its arrondissements.
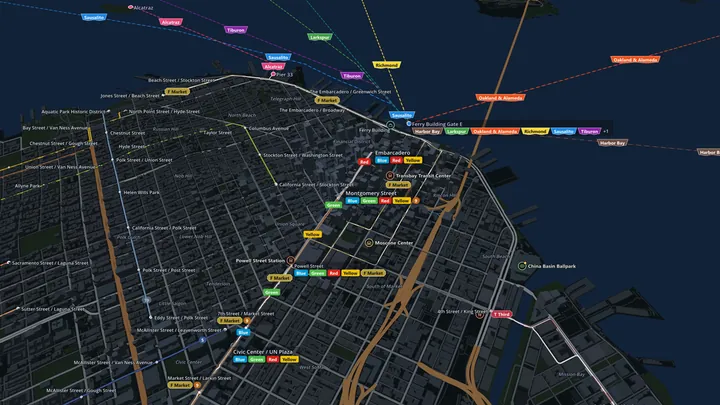
San Francisco
About 6.7 million residents in the map area, some 1.5 million buildings. With the Bay and the Golden Gate.
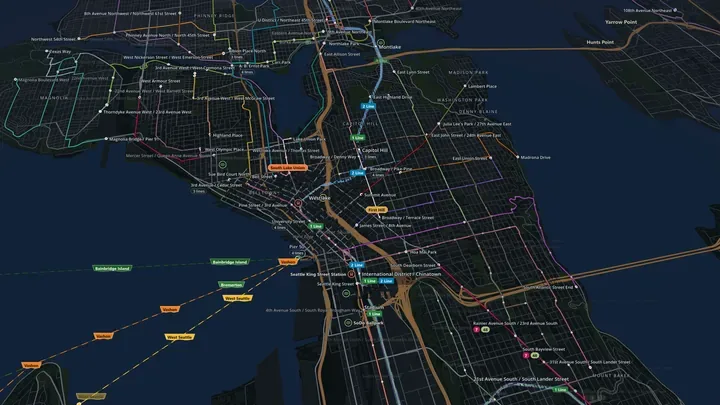
Seattle
About 4.5 million residents in the map area, some 1.2 million buildings. Between Puget Sound and Lake Washington.
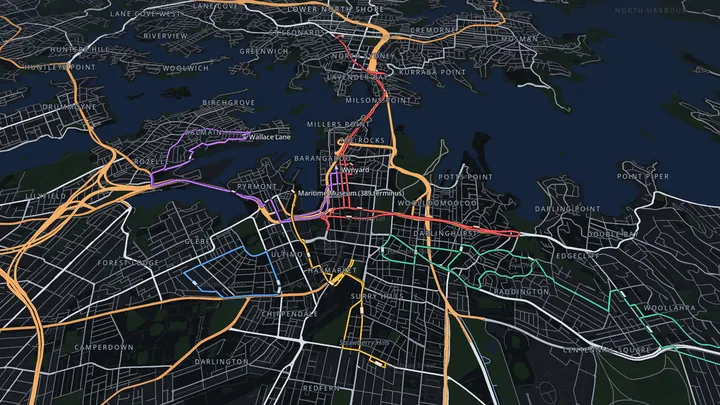
Sydney
About 5.6 million residents in the map area, some 1.3 million buildings. With its harbour and the Harbour Bridge.
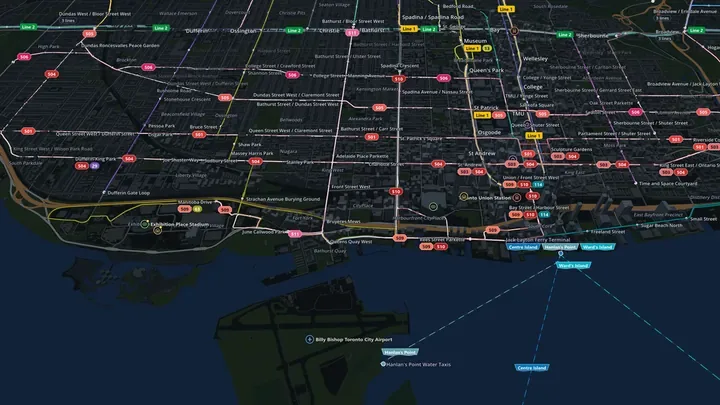
Toronto
About 8.8 million residents in the map area, some 1.2 million buildings. On Lake Ontario, with the Toronto Islands just offshore.
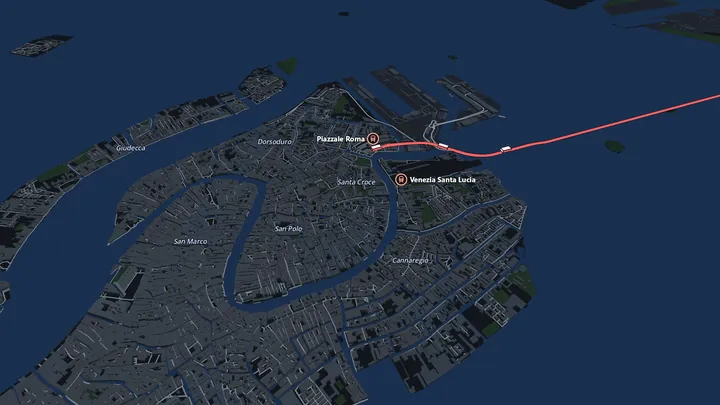
Venice
About 1.8 million residents in the map area, some 0.4 million buildings. With the lagoon, the old town and the causeway to the mainland.
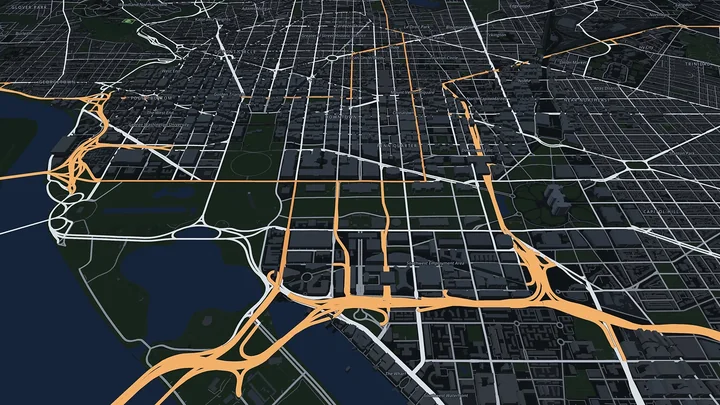
Washington D.C.
About 8.3 million residents in the map area, some 2.0 million buildings. With the Potomac and the National Mall.
Development status
In developmentTransit Rush is being built right now. A test version is played by a small group of testers; a release is planned, but there is no date yet.
Want to play along? The playtest sign-up runs on the Transit Rush Discord server.
The Steam page does not exist yet. As soon as it is online, the wishlist button will lead there. Until then there is no Steam link pretending to be more than it is.
Contact
Questions or feedback? Write an e-mail:
There is no newsletter, no form and no cookies here. Visits are only counted, without cookies and on my own server.